
So, ‘Heavy Ad Intervention’—yes, that’s the actual name—kicks in when Chrome looks at an ad and basically says, “Nope, this thing is way too much for your device to handle.
And not expensive in the fun, CPM way. Expensive in the ‘why is my laptop wheezing?’ way: battery, bandwidth, CPU, all getting absolutely rinsed.
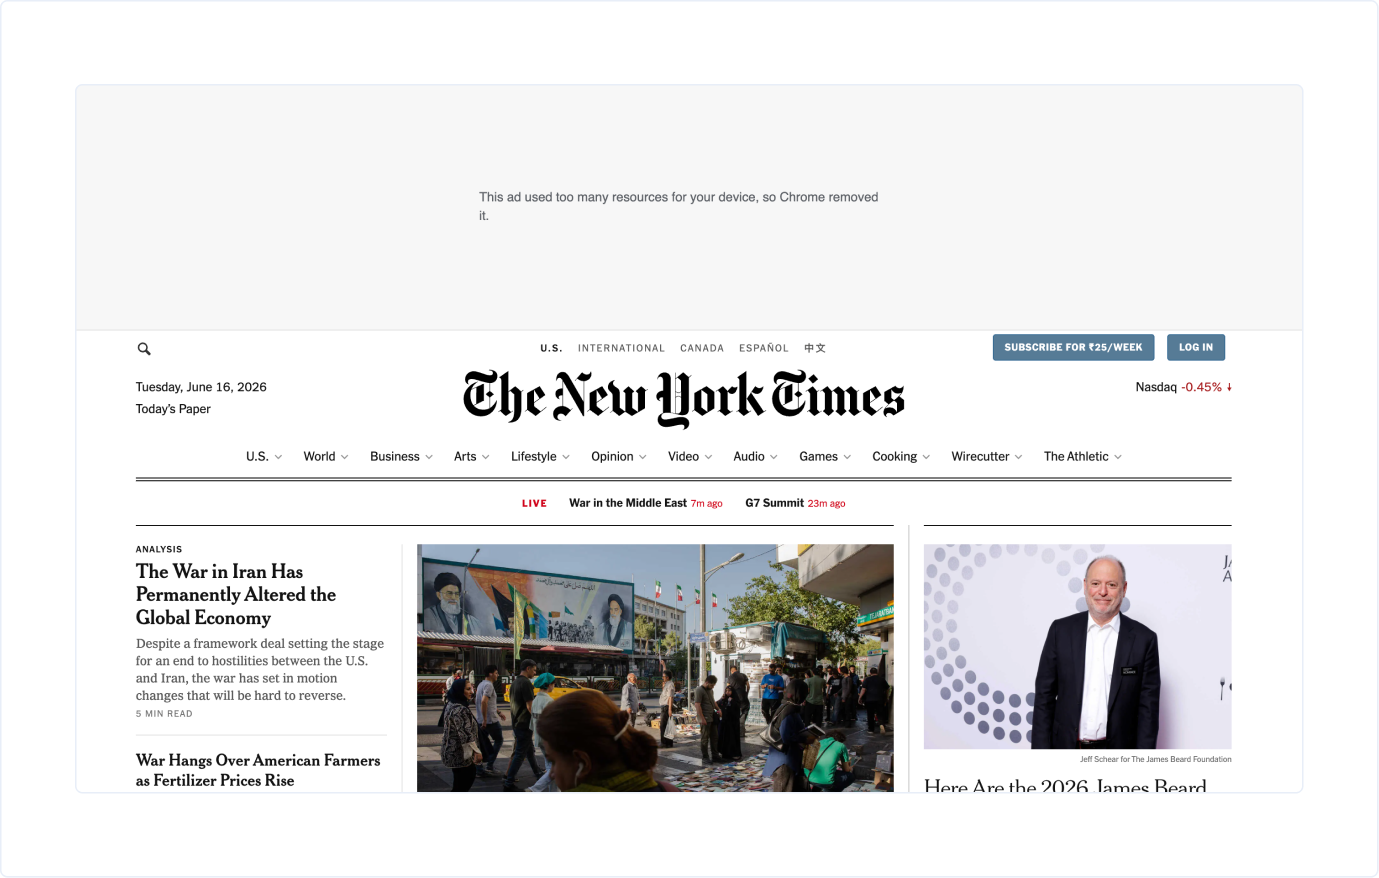
If an ad frame gets too greedy before you even click on it, Chrome just removes it from the page and replaces it with a gray ‘Ad removed’ notice box. For users, it’s a tiny act of mercy. For publishers, ad ops, and creative folks, it’s a public shaming: hey, someone in your ad supply chain went resource-heavy.
The short version:
| Chrome checks | Heavy ad threshold |
|---|---|
| Network usage | More than 4MB of bandwidth |
| Peak CPU usage | More than 15 seconds of main-thread CPU time in any 30-second window |
| Total CPU usage | More than 60 seconds of main-thread CPU time |
Those limits kick in before anyone even clicks, and yes, they count everything loaded by the endless stack of iframes hiding inside your ad frame. This is where the real pain starts. Modern ads are rarely just one file. A single slot can drag in scripts, pixels, verification tags, video players, and nested frames before anyone sees the ad.
This is your crash course in how Heavy Ad Intervention works, why you should care (even if you’re already tired), and how to set up a QA and monitoring process before Chrome gets to be the one to break the bad news about your ads. Because, trust me, you want to catch it before Chrome does.
Why Chrome Introduced Heavy Ad Intervention
Chrome rolled out Heavy Ad Intervention for a handful of ads that were using far more CPU and data than the rest. Not all ads, just the special few who treat your CPU like an all-you-can-eat buffet.

In the original Chromium announcement, Google said the thresholds were aimed at the most resource-heavy ads: ads using more CPU or network bandwidth than 99.9% of detected ads for that resource. Google also said that only 0.3% of ads exceeded the threshold at the time, but those ads accounted for 27% of network data used by ads and 28% of all ad CPU usage.
Heavy ad intervention
A tiny fraction of ads consumed a disproportionate share of resources
Only 0.3% of ads exceeded Google’s thresholds — but their resource footprint was outsized
Share of total ad network data used
Share of total ad CPU usage
So, the logic here is that most ads are fine-ish, but the truly chaotic ones are so bad that Chrome has to step in and play a browser-level safeguard role.
Chrome’s hall of shame includes things like uncompressed media, JavaScript that thinks it’s auditioning for Fast & Furious, background calculations, and video files that start loading before you even blink. Sometimes it’s villainy—hello, crypto-mining. Other times it’s just classic internet sloppiness: massive images, animation loops that forgot how to stop, and rich media units that have never once considered chilling out.
Of course, to you, as a user, none of this nuance matters. Your page crawls, your battery gasps for air, and your mobile data usage increases in the background.
How Heavy Ad Intervention Works
If you want to make sense of Heavy Ad Intervention, just picture it as Chrome running through a four-step routine. Like a little checklist for ad chaos.
Step one: Chrome plays detective and tries to figure out if a frame is ad-related. It does this by matching iframe resource requests against filter lists. The main page frame is not considered ad-related, even if it’s absolutely crawling with ad scripts. This whole thing is about the ad-tagged iframe content instead of the main event.
Next up, Chrome starts measuring how heavy the ad is—resource-wise—before you’ve even touched it. If you haven’t clicked or tapped, Chrome is already side-eyeing the ad and comparing it to its network and CPU limits.
Then comes the fun part. Chrome counts the entire frame chain. Every resource loaded by descendant iframes is tallied. So if your ad creative is nesting third-party trackers inside verification frames inside a video player, all of that still counts toward the ad’s running total.
And finally, when the ad crosses the line, Chrome just boots it out. You get the ‘Ad removed’ container. If you’re a developer or publisher, you can get intervention reports through the Reporting API.
One last thing that trips people up is that elapsed time is not the same as CPU time. Your ad doesn’t need to run for a full minute to get in trouble. What matters is how much main-thread work it does before the user interacts with it.
Heavy Ad Intervention vs Ad Blocking vs Core Web Vitals
These terms are often mixed up, but they solve different problems.
| Concept | What it targets | Publisher implication |
|---|---|---|
| Heavy Ad Intervention | Individual ad frames that exceed Chrome’s CPU or network limits | A specific ad can be unloaded even if the page itself remains available |
| Ad Blocking | Ads or trackers blocked by browser, extension, network, or user rules | Monetization can be reduced before an ad even has a chance to render |
| Core Web Vitals | Page-level loading, interactivity, and visual stability signals | Poor ad behavior can hurt page experience, but the metric is not specifically an ad-removal mechanism |
| Creative QA | Pre-launch review of assets, tags, behavior, and performance | The publisher or vendor catches heavy behavior before the browser does |
Heavy Ad Intervention sits between a few familiar categories. It is not a full ad blocker, but it can still block ads. It is not a page-speed metric, but it can affect the user’s experience of the page. And although the creative may come from an advertiser or vendor, the fallout usually lands on the publisher.
Why Publishers Should Care
First up: when Chrome decides to yeet your ad frame into oblivion, that ad delivery is gone. The value everyone was expecting—advertiser, exchange, publisher—just sort of evaporates. The revenue hit is one of those ‘it depends’ nightmares (stack, measurement, and so on), but the risk is real enough that you can’t just ignore it and hope for the best.
Second, users always blame the page. That sad little gray ‘Ad removed’ box in the middle of your article doesn’t scream ‘responsible browser policy.’ It screams, ‘something is broken, and nobody cares.’ And nobody is going to reverse-engineer the entire SSP/DSP/verification/creative/iframe connectivity to figure out what happened.
Third, Heavy Ad Intervention is a spotlight on all the places your vendor governance is… let’s say, less than robust. Most publishers aren’t hand-crafting every creative that lands on their pages. Demand partners, agencies, rich media vendors, verification tools, analytics tags—everyone gets to add their own little brick to the load. But at the end of the day, it’s still your page.
Fourth, performance now belongs in monetization ops. Ad weight, CPU cost, network transfer, and third-party tags can all affect whether an impression actually delivers. Publishers need to treat performance work as part of protecting the value of inventory.
The uncomfortable truth is that if you can’t see which creative, frame, or demand source triggered the intervention, you can’t fix the revenue leak or the broken user experience. You’re just guessing and hoping, which is not a real strategy (ask me how I know).
The Strategic Questions Publishers Should Answer
The tactical question is, “How do we keep this ad under Chrome’s limits?”
The strategic question is, “Who owns ad resource quality across the whole path from creative upload to page render?”
For most publishers, the answer is… well, a mess. Creative teams clutch their assets. Ad ops are busy wrangling trafficking. Revenue teams are off nurturing demand relationships. Engineering is somewhere in the weeds with page performance. Vendors? They’re off in their own world, handling verification, rich media, measurement tags, and so on.
And Heavy Ad Intervention is sitting in the middle, like the one problem at the party that nobody wants to claim. So, naturally, everyone just sort of hopes it’s someone else’s job.
So, what would it look like if this whole workflow had a clear owner?
Here is a cleaner way to answer the problem.
| Strategic question | Better answer |
|---|---|
| Who should own Heavy Ad Intervention risk? | Ad ops should own the workflow, with engineering providing measurement and revenue teams enforcing partner requirements. |
| Should publishers ban rich media or video ads? | Not necessarily. The safer rule is to control when heavy assets load, especially before user interaction. |
| Is the creative file size enough to approve an ad? | No. CPU usage, nested frames, third-party scripts, and repeated requests can all cause problems, even when the main asset appears small. |
| Should this be handled before or after launch? | Both. Pre-launch QA reduces obvious failures; post-launch reporting catches bad demand paths and real-page behavior. |
| What should vendors be accountable for? | Asset weight, pre-interaction loading behavior, third-party tags, nested frames, and the ability to identify the creative or demand source when an intervention happens. |
| What should publishers measure internally? | Slot, iframe URL, creative ID, buyer or demand source, trigger type, device context, and timestamp. |
Common Causes of Heavy Ads
Most heavy ads are not mysterious. They usually come from ordinary ad-tech problems: oversized assets, too many tags, or scripts that keep running after the page loads.
Common causes include:
- Large images that were not compressed properly
- Auto-loading video before a click or tap
- JavaScript-heavy rich media units
- Animations that keep triggering layout and paint work
- Repeated network requests from trackers or pixels
- Full JavaScript libraries loaded for one small creative behavior
- Nested iframes that pull in more scripts, media, or tags
- Analytics or verification tags inserted directly into the creative
- Bugs that cause repeated calls, loops, or runaway rendering work
The important part is that file size is not the whole story.
An ad can stay under 4MB and still be removed because it burns too much main-thread CPU. So the publisher’s QA question should not be, “Is the file small?” It should be, “What does the full ad frame do after it loads?”
How To Test Heavy Ad Intervention Before Go-Live
Chrome DevTools gives you the basic toolkit.
Use the Rendering panel to enable “Highlight Ad Frames.” In the Elements panel, check whether the detected ad iframes show the ad annotation. In the Network panel, use the Is ad-related filter where available and disable cache for more consistent test runs. In the Application panel’s Frames section, check the frame’s Ad Status.
For network usage, start in the Network panel. Sort requests by size to catch oversized media. Use the Initiator tab to see what an initial ad request triggers. Repeated, smaller requests can matter too, so do not hunt only for one giant file.
For CPU usage, record in the Performance panel. Focus on scripting, rendering, and painting. Use CPU throttling to simulate lower-powered devices, because a developer’s laptop can make a bad creative look innocent.
The Chrome for Developers guide also points to heavy-ads.glitch.me as a test environment for loading content inside an ad-tagged iframe. That can help isolate a creative from the rest of the page when you need to reproduce behavior.
Testing in isolation is useful. Testing in the real page environment is better.
The real page includes lazy loading, header bidding, consent flows, viewability vendors, analytics, and whatever else your stack brings into the auction. Heavy ads often appear at the intersections, not in the clean-room demo.
How To Monitor Heavy Ad Interventions
As mentioned above, Chrome can generate intervention reports through the Reporting API. Current Chrome documentation says reports can be sent to the ad frame and its descendants, and also to the embedding frame. That matters for publishers because the parent page can receive more context about the child frame that triggered the problem.
At a high level, publishers should capture:
- Page URL
- Ad slot
- iframe ID
- iframe URL or pre-redirect URL where available
- Creative ID
- Buyer, campaign, or demand source
- Intervention reason
- CPU or network trigger
- Timestamp
- Browser and device context
Chrome’s current documentation uses the Reporting-Endpoints response header for HTTP reports:
Reporting-Endpoints: default=”https://example.com/reports”Older examples may show Report-To, so check your current browser support and reporting setup before copy-pasting from old implementation notes.
If you use JavaScript reporting via ReportingObserver, remember that the iframe may disappear during the intervention. Chrome’s guidance recommends using pagehide to pull pending reports before the frame disappears, and navigator.sendBeacon() for best-effort delivery.
That reporting loop is the control layer publishers need. Without it, the browser may remove ads in front of users, while your internal dashboards are unable to surface the issue
What To Put in a Publisher QA Checklist
The Official Heavy Ad Intervention Workflow requires exactly four gates.
First up: the creative budget. You set a hard limit for network transfer and CPU before anyone even interacts. The network budget should stay well below Chrome’s 4MB threshold, unless you enjoy living dangerously.
Next comes the tag review, aka the part where you get to investigate and audit every third-party pixel, verification script, nested frame, and mysterious library that someone quietly slipped in. For each one, you have to ask: Do we need this? Does it really have to load before anyone does anything? Or can it just… wait its turn, like a polite guest who knows how to read a room?
Third gate: device-realistic testing. This is where you throttle the CPU, dig out your slowest phone, and see what happens. If your creative only behaves on a high-end desktop with a fiber connection, congratulations, it’s not ready for the real internet.
And finally, the fourth gate: post-launch reporting. Intervention reports should tell you something useful—like which slot, creative, vendor, and demand source are to blame. A report that just says “CPU limit exceeded” is… fine, I guess. But a report that tells ad ops exactly which buyer, creative, and iframe chain caused the problem? That’s the dream.
Here is the practical checklist:
- Compress images and video assets before trafficking
- Avoid auto-loading large video files
- Require click-to-play for heavy video or rich media
- Remove unnecessary JavaScript libraries
- Avoid continuous animation loops and expensive layout work
- Review analytics, verification, and tracking tags inside creatives
- Audit nested iframes and third-party calls
- Test CPU usage, not just creative weight
- Use Chrome DevTools to verify ad-frame detection
- Test on throttled CPU or lower-powered devices
- Configure Reporting API monitoring
- Map intervention reports back to creative and vendor metadata
- Add resource-budget requirements to vendor and creative specs
This is where the operational shift happens. Heavy Ad Intervention is not solved by a single developer checking a single ad once. It is solved by making ad resource usage part of the normal trafficking workflow.
What If Chrome Tags the Wrong Frame?
Misclassification can occur when Chrome identifies ad-related frames via filter-list matching.
If non-ad content is being treated as ad-related, Google recommends checking the frame’s ad status in DevTools. If the issue comes from URL patterns that look ad-related, you may need to change those patterns or work with the relevant filter-list maintainers. Chrome also provides a route to report incorrect interventions when you have a reproducible sample and an intervention report.
The practical advice is not to debug blindly.
First, confirm whether Chrome sees the frame as ad-related. Then confirm whether the frame crossed a CPU or network threshold. Only after that should you decide whether this is a creative problem, a vendor problem, or a classification problem.
Where Publishers Go From Here
It is easy to dismiss Heavy Ad Intervention as another obscure browser feature. Publishers should not. By the time Chrome removes an ad, the user has already seen the broken-looking slot and felt the page slow down. The problem has already reached the page experience.
And no, the answer is not just ‘make the files smaller’ and call it a day. What you need is a workflow that pokes at every part of the ad frame. Also, the practical path is not rocket science, but it does require a little ritual: set resource budgets, test your creatives in the wild (not just in your perfect staging environment), keep an eye on those intervention reports, and trace every single issue back to the creative, slot, vendor, or demand source that spawned it.
Yes, it’s a pain. But it’s the only way.
The sooner you catch these things yourself, the fewer times you have to watch Chrome step in and do your job for you.